This was out first day of the lab. We played around with how much drops of yeast we could put into the test tubes of peroxide and water. We wanted to find out how much yeast we could put in to make the pressure in the tube to increase making the rate go up.
On the second day of the lab we tested temperature changes of the test tube and how it would affect the pressure of the tube. We started at cold water putting 30 drops of yeast into the tube and putting the tube in cold water. The cold water didn't have much of an affect to the peroxided and water. The next temperature was when we put the test tube in warm water, with the same amount of drops of yeast as the first one the rate of pressure was the most out of all the temperatures we used. it was at a 26.55. the next temperature was hot water the pressure went down. the highest amount of pressure was when it was in the middle at warm water temperature.
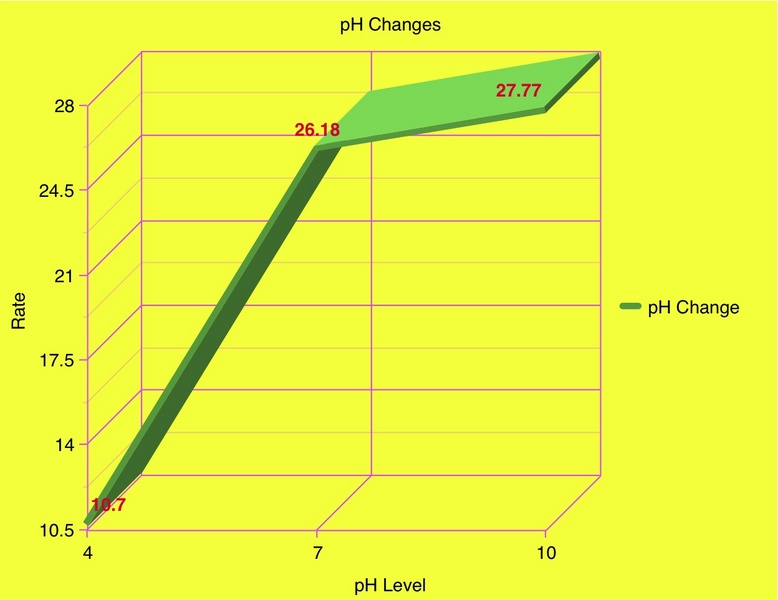
The third lab graph shows that the lower PH level there is the lower the rate of pressure is.
In the end i learned a lot about enzymes. I didn't know that yeast would affect peroxide and water or that the temperature of the test tub would change the pressure. i thought that maybe the higher it gets the higher the pressure but that wasnt the case of it. I had a lot of fun doing this lab and watching the top pop off of the test tube.


No comments:
Post a Comment